US Migration Patterns Map: Trends, Drivers, and Impacts
In this guide you will discover how migration flows across the United States shape its demographic landscape, economic development, and regional growth. We will walk through historical trends, current patterns, key drivers, and the implications that policymakers and businesses must consider. By the end, you will have a clear understanding of how to read migration maps and what the numbers mean for communities nationwide.
Understanding the Basics of Migration Maps
Migratory maps translate complex data into visual insights, illustrating the volume and direction of people moving from one region to another. Typically, the color intensity or line thickness indicates the magnitude of flow, while directional arrows or gradient shading reveal predominant paths. A map that highlights U.S. migration patterns will often compare domestic movements—such as from the Midwest to the South—with international immigration flows.

Historical Migration Trends in the United States
From the late 19th century to the 1950s, the U.S. experienced a westward shift fueled by railroad expansion and the promise of agricultural opportunities. The Great Migration, spanning 1916 to 1970, saw millions of African Americans relocate from the rural South to Northern industrial centers, reshaping urban demographics. Post‑World War II suburbanization further dispersed populations, driven by the GI Bill and a boom in automobile ownership.
These historical movements laid the groundwork for contemporary patterns. For example, the exodus from high-cost coastal cities to more affordable interior states can be traced back to the same desire for economic opportunity and quality of life that motivated earlier migrations.
Current Migration Patterns Revealed by Recent Data
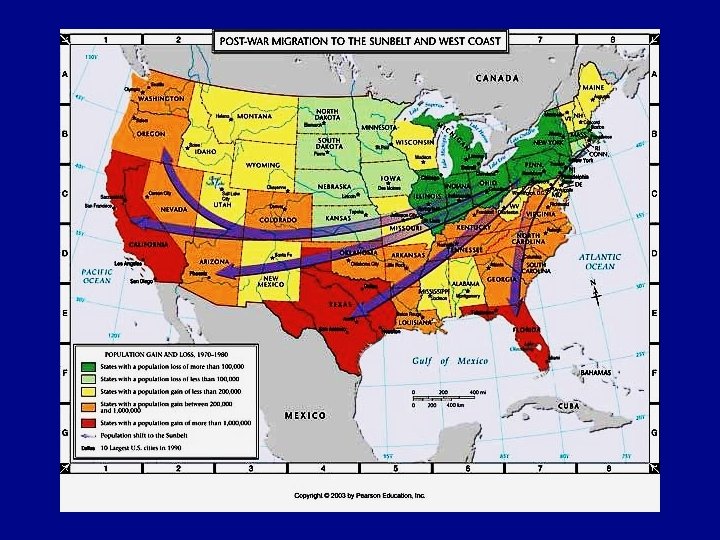
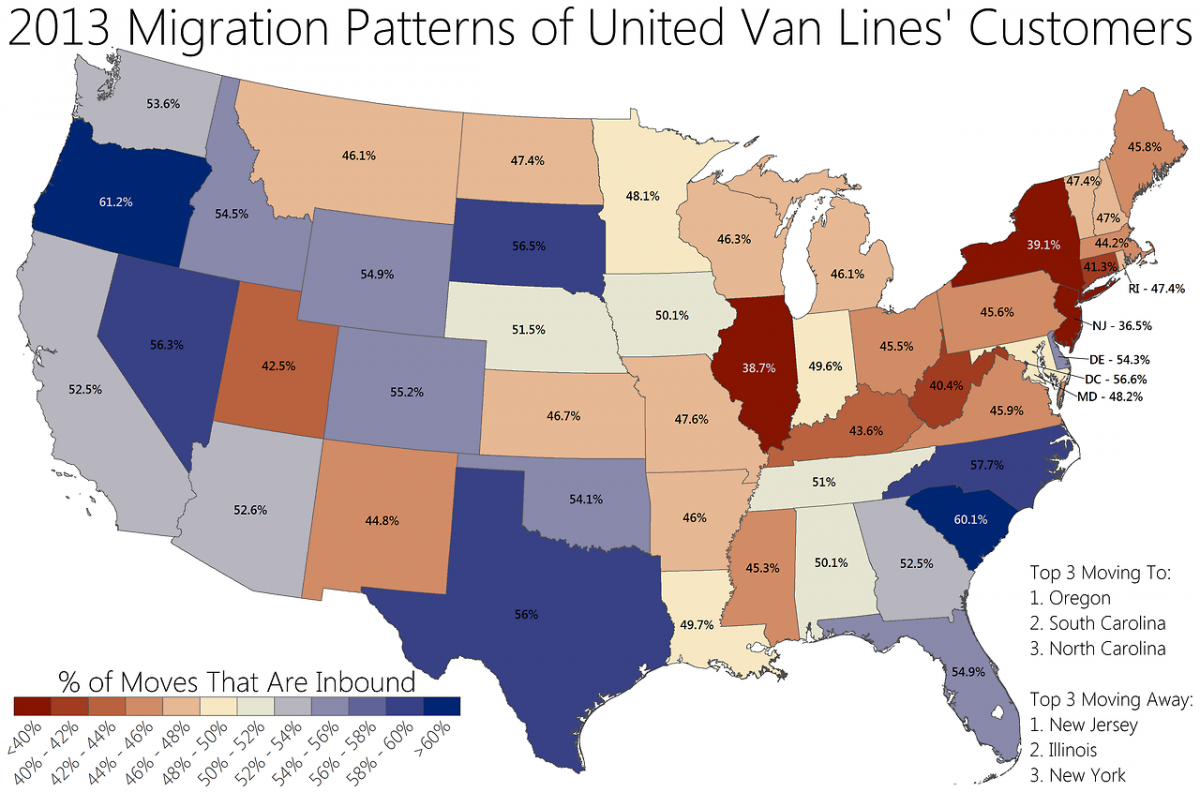
Modern U.S. migration data highlight a reversal of some traditional flows. While the Northeast continues to send residents to the South and Midwest, the South and West are increasingly attracting newcomers from all regions. This trend is reflected in the latest census map that shows the shift in domestic migration flows.
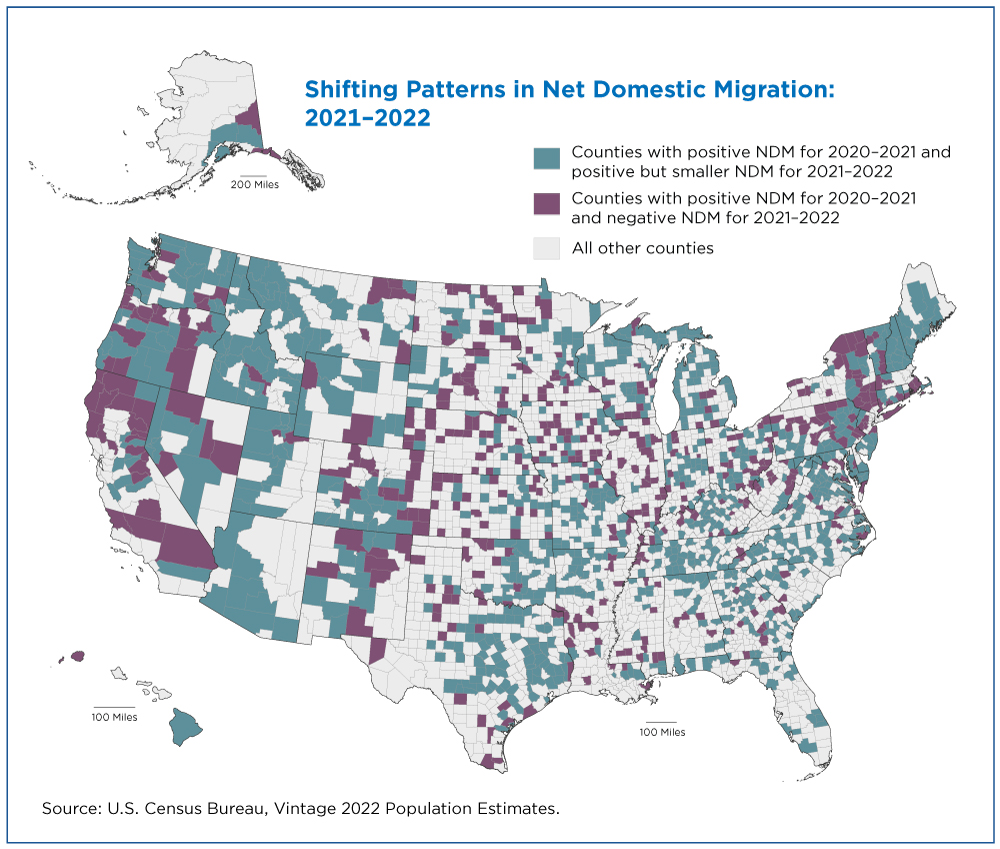
The map demonstrates that states like Texas, Florida, and Arizona are experiencing net gains, whereas states such as New York, Ohio, and Michigan are witnessing net losses. The magnitude of these changes underscores the evolving economic landscape and the role of technology-enabled remote work.
Key Drivers Behind Contemporary Migration
1. Economic Factors
Job availability, wage growth, and cost of living remain primary motivators. States offering lower housing costs, higher wages in emerging industries, and favorable tax policies tend to attract more migrants.
2. Lifestyle and Climate Preferences
Many residents are drawn to states with milder climates, outdoor recreation opportunities, and a perceived higher quality of life. This trend has accelerated the population growth of states with sunny weather.
3. Policy and Immigration Reform
Changes in immigration policies and visa programs can alter the composition of migration flows, influencing both domestic and international movements.
4. Technological Advances
Remote work capabilities allow professionals to relocate without sacrificing employment, contributing to a more dispersed population distribution.
Economic and Demographic Impacts of Migration
Population influxes can stimulate local economies through increased labor supply, higher consumer demand, and entrepreneurial activity. Conversely, net outflows may strain public services and reduce tax revenues. Demographically, migration can alter age structures, educational attainment levels, and cultural diversity, influencing everything from school enrollment to political representation.
For example, Florida's rapid growth has led to expanded infrastructure projects and heightened demand for healthcare services. Meanwhile, Michigan’s declining population has prompted city governments to reevaluate budget allocations and public transportation strategies.
Regional Case Studies
Texas
Texas has become a migration magnet, with a combination of business-friendly policies, abundant job opportunities in energy, technology, and manufacturing, and a comparatively low cost of living. The influx of residents has accelerated housing development and spurred a surge in commercial real estate.
New York
New York City and the broader New York State region face a net loss of residents. Factors include high living costs, taxation, and a shift toward remote work. The state is exploring economic incentives and infrastructure investments to retain and attract talent.
Arizona
Arizona’s warm climate, growing tech sector, and proximity to international borders make it a focal point for both domestic migration and international immigration, creating a dynamic demographic mix.
Policy Implications and Strategic Planning
Governments can leverage migration data to inform long-term planning. Housing policies must accommodate shifting population densities, while educational systems need to anticipate enrollment changes. Infrastructure investments—especially in transportation and broadband—should align with anticipated growth corridors.
Businesses can use migration trends to identify emerging markets, optimize supply chains, and target workforce recruitment. Understanding regional preferences helps companies position themselves where demand and talent pools align.
Future Outlook: Predicting the Next Decade
Experts anticipate continued migration toward the Sun Belt, driven by climate resilience, economic opportunity, and teleworking trends. States in the Midwest may see renewed interest as remote work reduces the need to live near large metropolitan hubs. However, the impact of climate change—particularly extreme heat and drought—could alter the desirability of currently popular destinations.
In addition, policy shifts, such as changes to immigration law, could influence the composition of migration flows, potentially increasing the proportion of international migrants or altering internal migration patterns.
Conclusion
US migration patterns are dynamic, reflecting economic realities, lifestyle preferences, and technological shifts. By studying comprehensive migration maps, stakeholders—from policymakers to business leaders—can gain actionable insights into where the population is headed and why. Understanding these flows equips communities to adapt, invest strategically, and foster sustainable growth across the nation.
Vibrant Migration Patterns In The United States | Great Migration Us

Vibrant Migration Patterns in the United States | Great migration us ...
Net Migration Patterns For US Counties
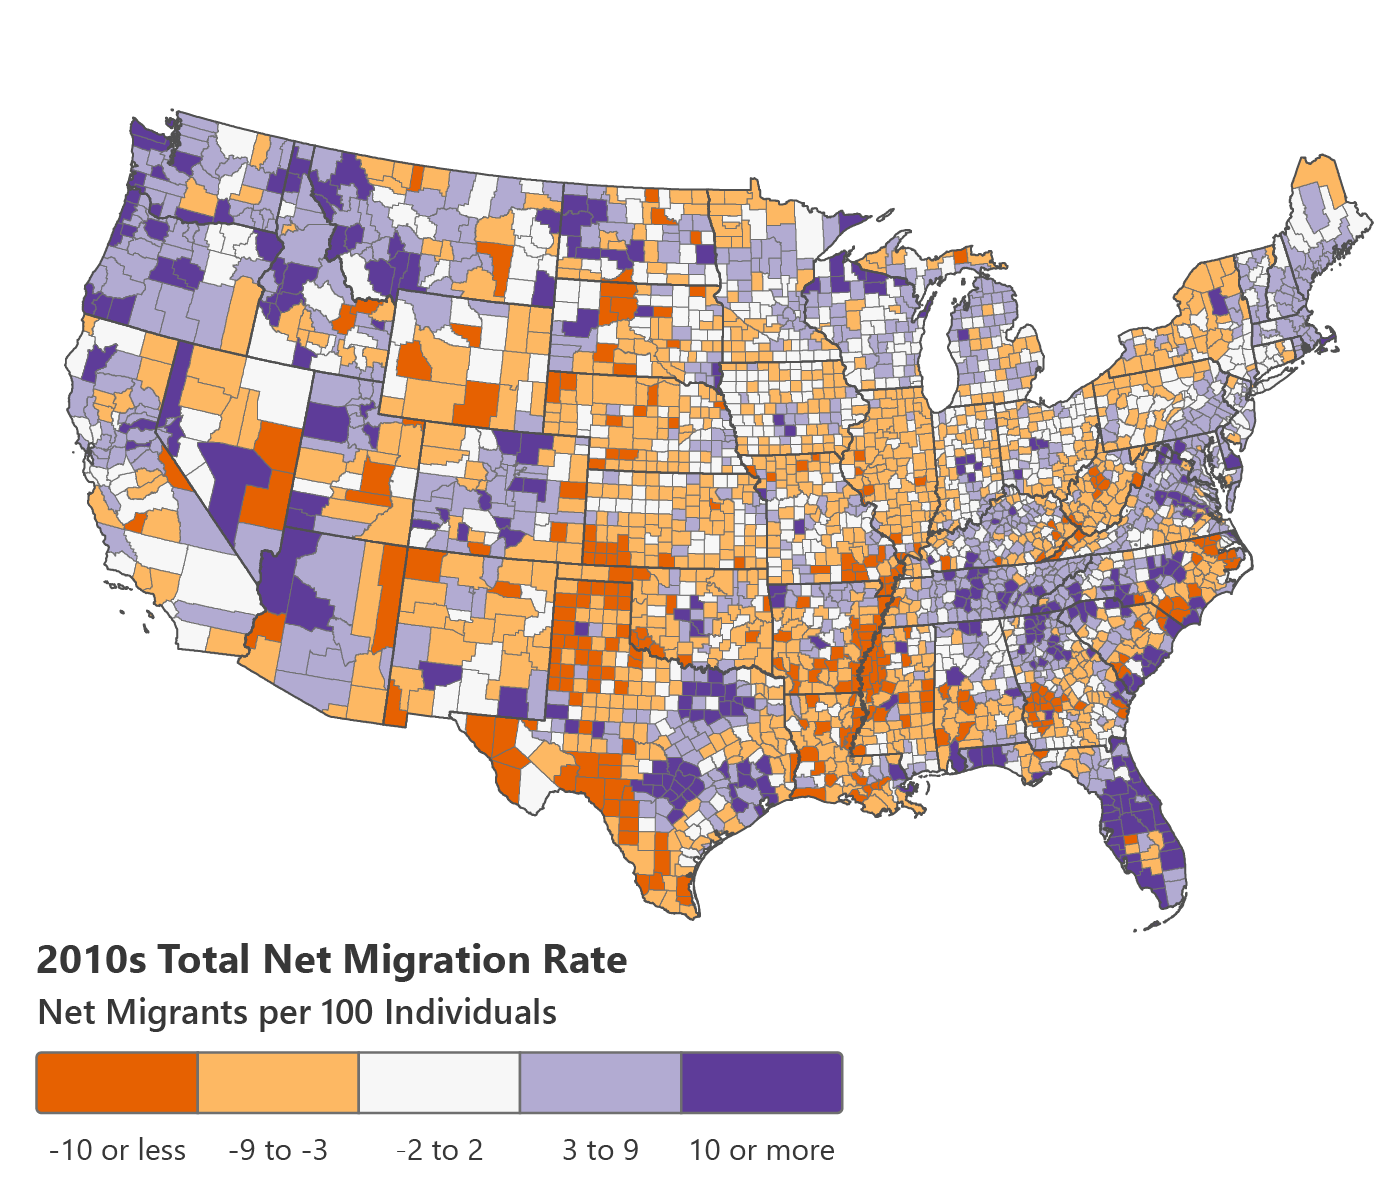
Net Migration Patterns for US Counties
Real Estate Migration Patterns - Active Properties

Real Estate Migration Patterns - Active Properties
Net Migration By State – Net Migration Patterns For US Counties – VLBLM

Net Migration By State – Net Migration Patterns for US Counties – VLBLM
U.S. Migration Patterns And Reasons Infographic | Atlas Van Lines

U.S. Migration Patterns and Reasons Infographic | Atlas Van Lines ...
Great Depression Migration Map

Great Depression Migration Map
Us Migration Patterns 2022 Map At Jaime Heffington Blog

Us Migration Patterns 2022 Map at Jaime Heffington blog
Emigration Map
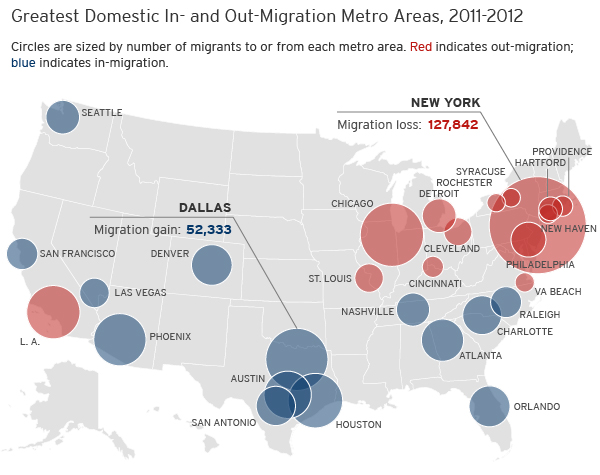
Emigration Map
Domestic Migration In The United States. - Maps On The Web

Domestic migration in the United States. ... - Maps on the Web
Us Population Migration Map , 2020 Census Demographic Data Map Viewer
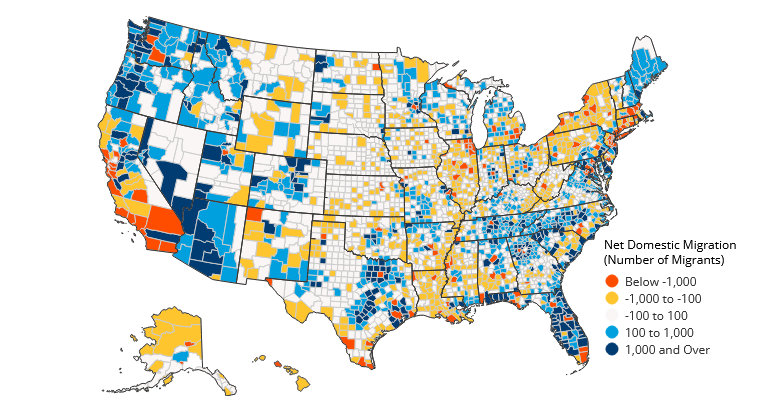
Us Population Migration Map , 2020 Census Demographic Data Map Viewer ...
American Migration [Interactive Map] - Forbes | Map, Data Visualization

American Migration [Interactive Map] - Forbes | Map, Data visualization ...
American Migration Patterns Map
American Migration Patterns Map
Map Monday: US States By Migration Patterns | Streets.mn

Map Monday: US States by Migration Patterns | streets.mn
Map Of The Week: Migration To The Americas | UBIQUE

Map of the Week: Migration to the Americas | UBIQUE
Discover USA Bird Migration Routes Essentials

Discover USA Bird Migration Routes Essentials
Mortgage Data Shows American Migration Patterns | Rocket Mortgage

Mortgage Data Shows American Migration Patterns | Rocket Mortgage
United States Migration Patterns Internal Internal US Migration
United States Migration Patterns Internal Internal US Migration
Mapping Internal Migration - Original Global Map

Mapping Internal Migration - Original Global Map
Interactive Map Shows The Migration Patterns Of... - Maps On The Web

Interactive Map Shows the Migration Patterns of... - Maps on the Web
Migration Patterns In Usa | Immigration Trends In The Usa – ZFVACM

Migration Patterns In Usa | Immigration Trends In The Usa – ZFVACM
Plan Your Next 'move' With This Map Of US Migration Patterns - Matador
Plan your next 'move' with this map of US migration patterns - Matador ...
