US Energy Production Map Guide: Visualizing the Nation's Grid and Renewable Landscape
In this guide you’ll discover how to read and interpret the United States energy production map, understand the complex web of generation sources, explore regional variations across the grid, and learn what the future holds for both traditional and renewable energy. By the end, you’ll be able to analyze the map’s insights and discuss the key drivers behind the nation’s power supply.
Overview of US Energy Production
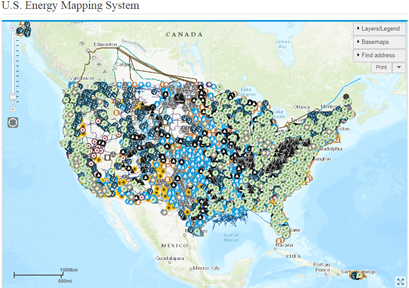
The United States produces electricity from a diverse mix of sources, including natural gas, coal, nuclear, hydroelectric, wind, solar, and other renewables. The energy map visually aggregates this information, showing not only the amount of power generated by each source but also how it’s distributed geographically. This data is essential for policy makers, industry analysts, and anyone interested in energy economics.
Grid Infrastructure and Distribution
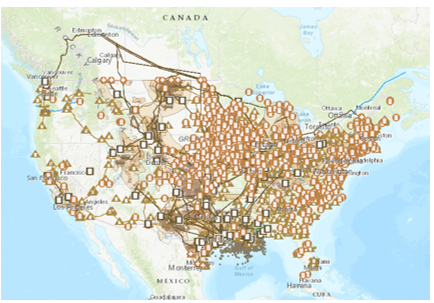
The national grid is a sprawling network of high‑voltage transmission lines and substations that transport electricity from power plants to end users. The map highlights major transmission corridors and interconnection hubs that facilitate long‑distance power flow. These corridors are critical for balancing supply and demand across time zones and for integrating renewable resources located in remote regions.

Renewable Energy Landscape
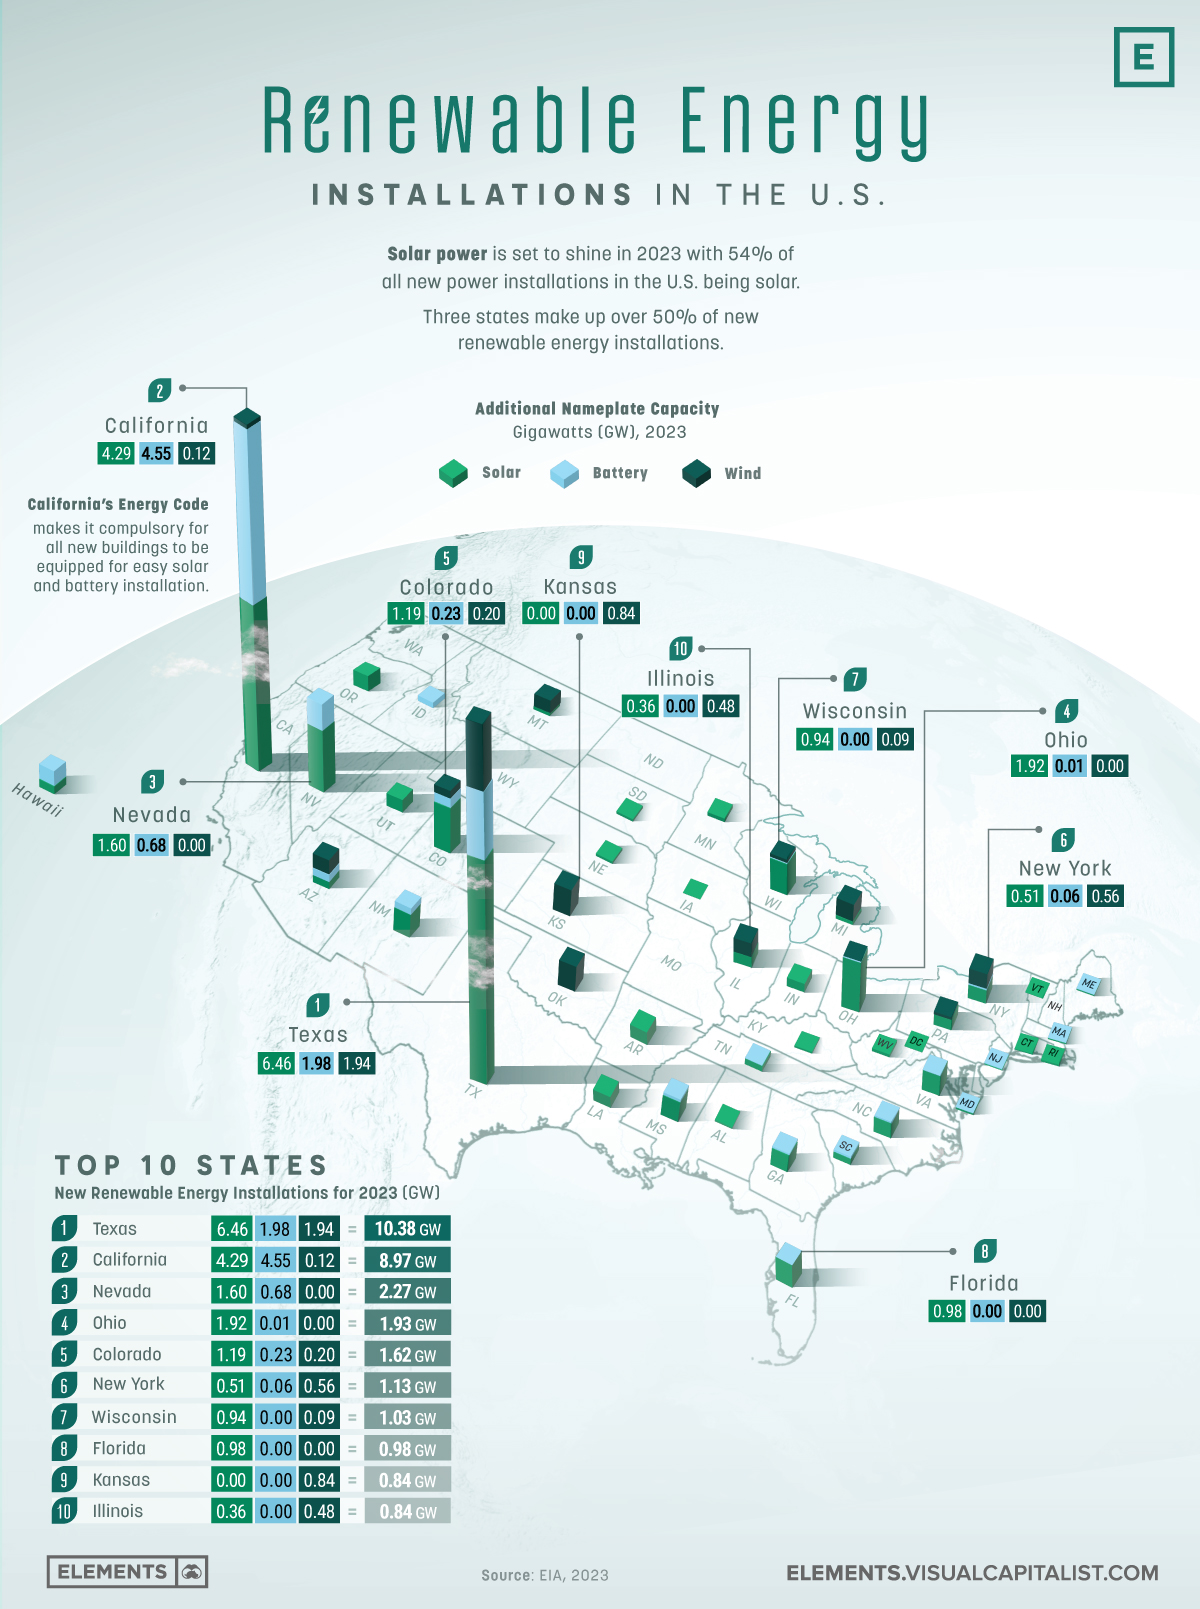
Renewable generation, particularly wind and solar, has surged in recent years. The map marks wind farms along the Midwest, Gulf Coast, and coastal plains, while solar installations cluster in the Southwest and parts of the Midwest. These visuals reveal how geographic advantages—such as high wind speeds in the Great Plains or abundant sunshine in California and Arizona—drive renewable deployment.
Energy Mix by State
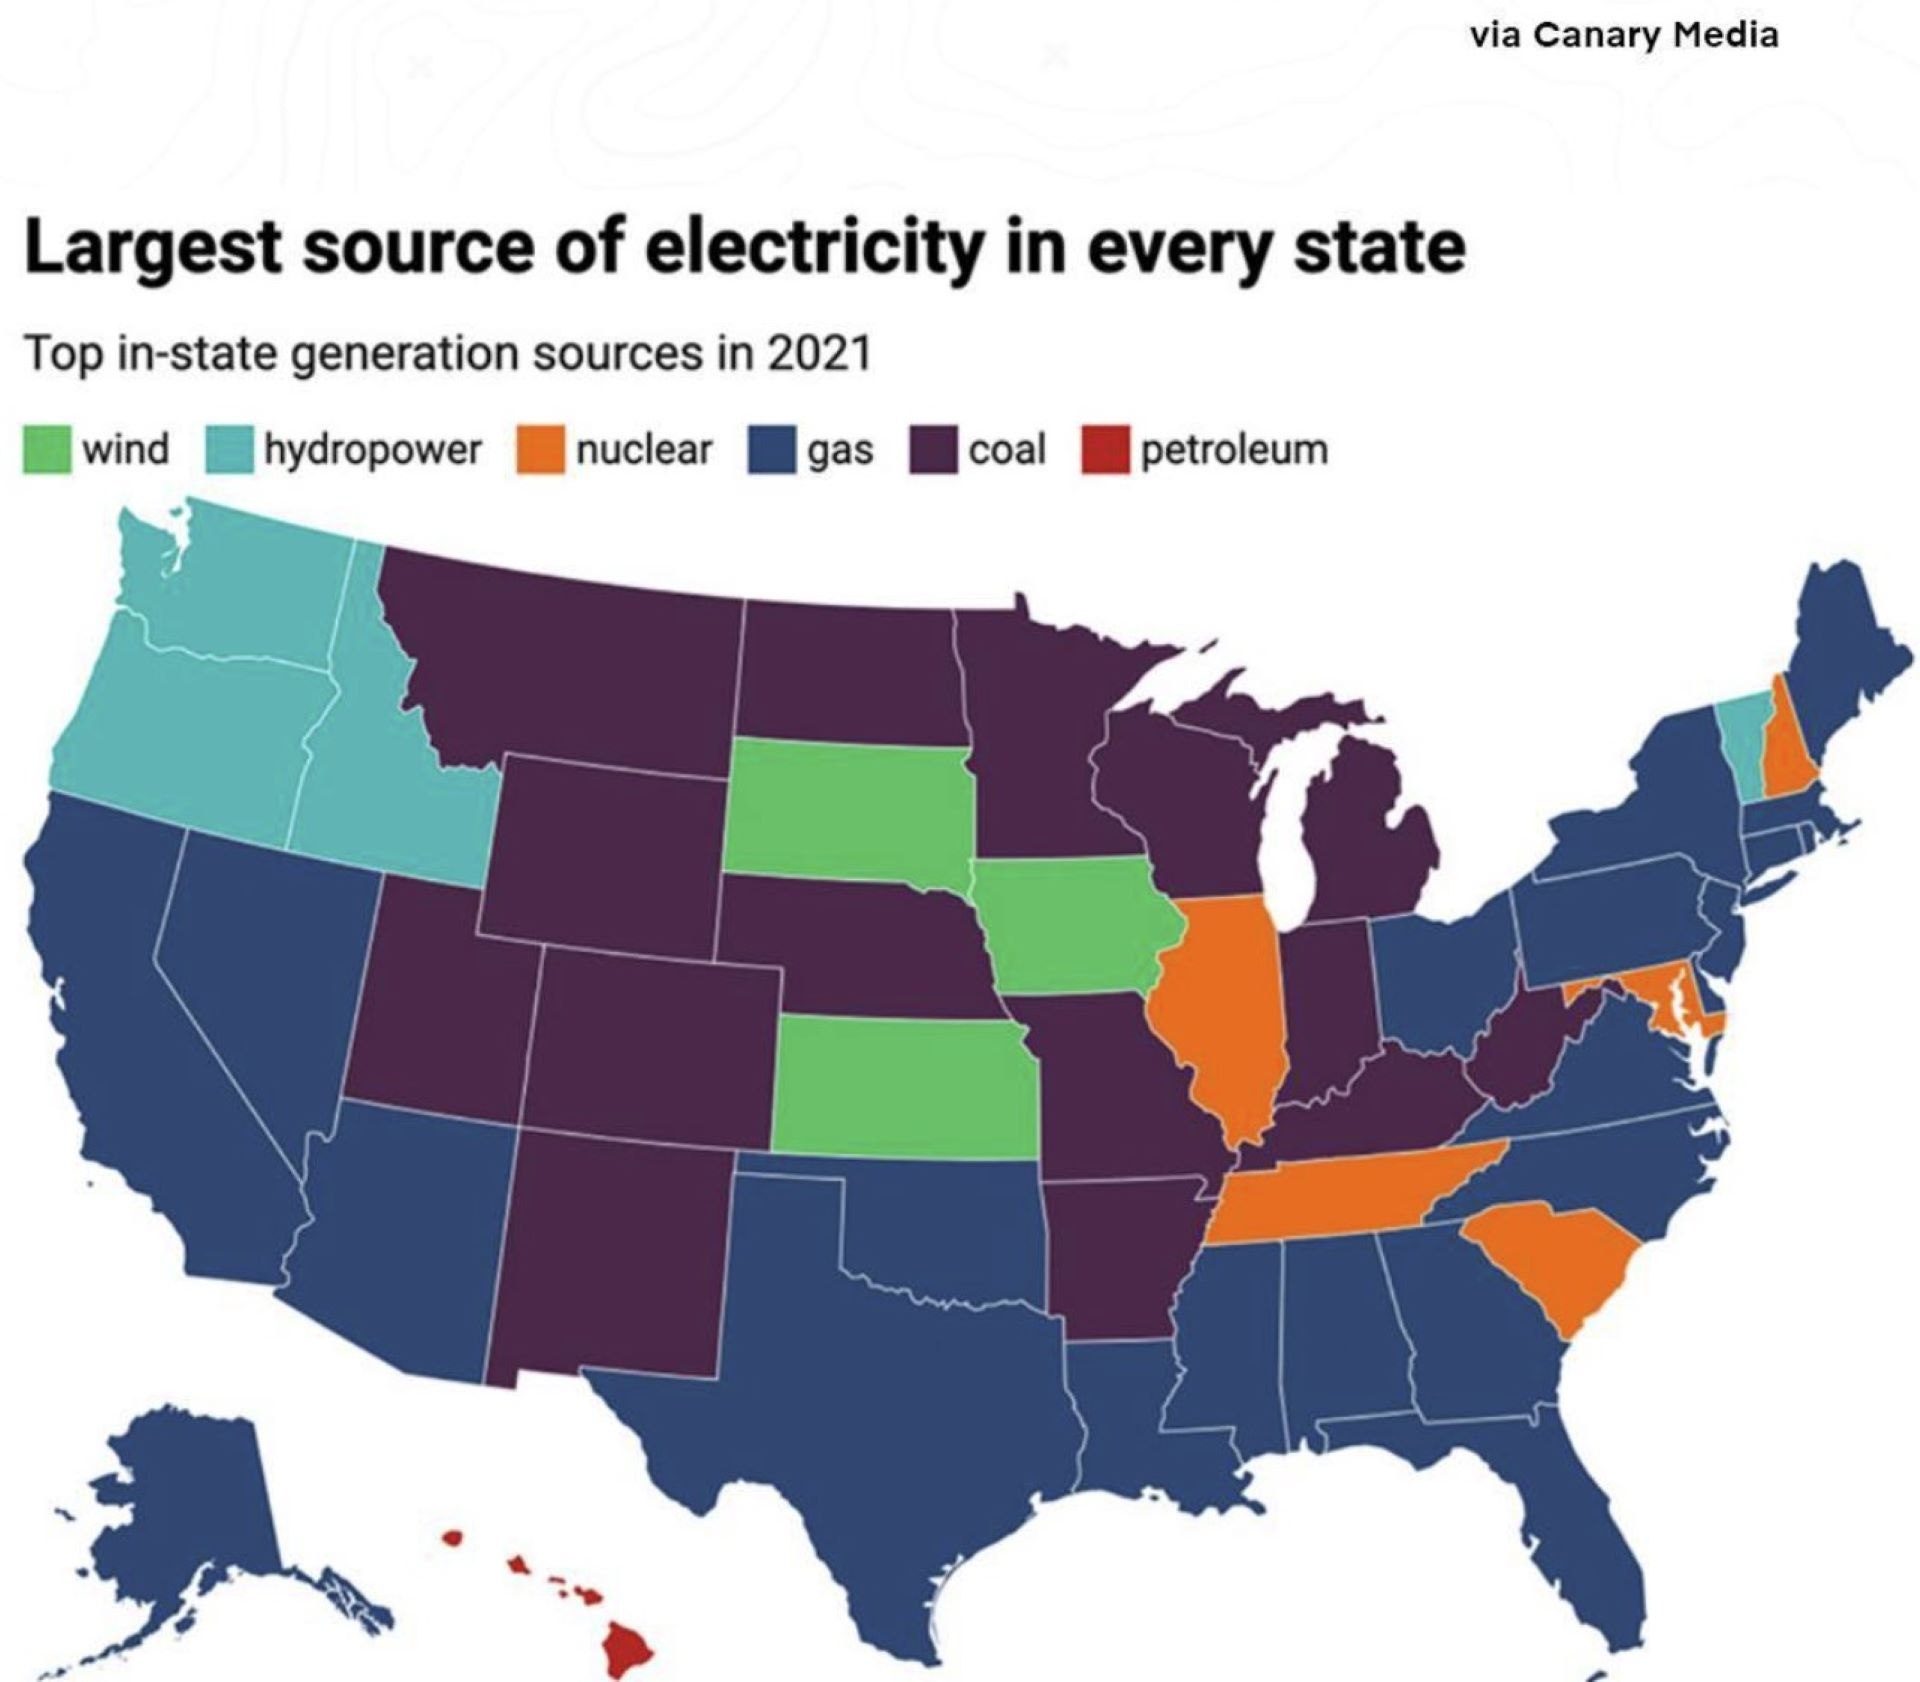
State‑level data shows varied energy mixes. For example, California leads in solar capacity, whereas Texas dominates natural gas and wind output. The map’s color coding allows quick identification of each state's dominant generation source, revealing regional dependencies and resilience factors.
Regional Differences and Energy Dependence
Geography heavily influences energy strategies. The Northeast relies more on natural gas and nuclear power, while the Southwest leans on solar and natural gas. Understanding these differences helps explain why certain regions are more vulnerable to supply disruptions and how they adapt to changing market dynamics.
Future Trends and Expansion Plans
Emerging technologies and policy shifts are shaping the next generation of the grid. Smart grid deployments, battery storage installations, and high‑capacity transmission upgrades are on the rise. The map’s predictive overlays can illustrate planned expansion projects, such as new interstate lines to connect renewable hubs with high‑demand zones.
Challenges Facing the Grid
Key challenges include aging infrastructure, cybersecurity threats, and balancing intermittent renewable output with steady baseload demands. The map’s heat‑mapping features can pinpoint hotspots where maintenance or upgrades are most needed, helping stakeholders prioritize investments.
Policy and Incentives Impacting Energy Production
Federal and state policies—such as tax credits for renewable energy, carbon pricing mechanisms, and subsidies for clean tech—directly influence the map’s evolving landscape. By overlaying policy timelines onto the grid map, analysts can correlate policy introductions with spikes in renewable deployment or reductions in fossil fuel generation.
Conclusion
The U.S. energy production map is a powerful tool that brings clarity to a complex, dynamic system. By dissecting the grid, examining regional energy mixes, and tracking policy influences, we gain insight into how America’s power is produced, transmitted, and managed. Armed with this knowledge, stakeholders can make informed decisions to strengthen reliability, reduce emissions, and foster sustainable growth in the energy sector.
US Energy Production Hubs Map Interactive American Power Plant Geography

US Energy Production Hubs Map Interactive American Power Plant Geography
Us Energy Production Map

Us Energy Production Map
Energy Production By State

Energy Production By State
Us Energy Production Map

Us Energy Production Map
Energy Production Over The Years | Department Of Energy

Energy Production Over the Years | Department of Energy
Map Of United States Energy Sources
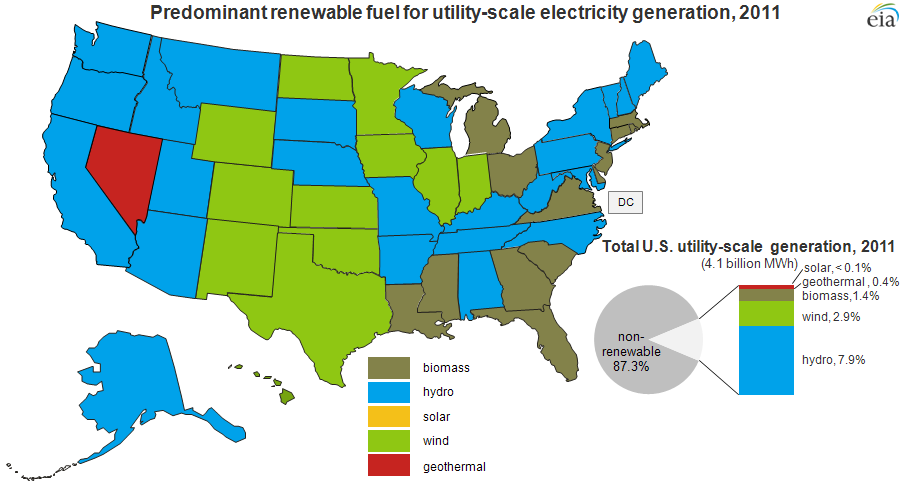
Map Of United States Energy Sources
File:Map Of Major Renewable Energy Resource In The Contiguous United
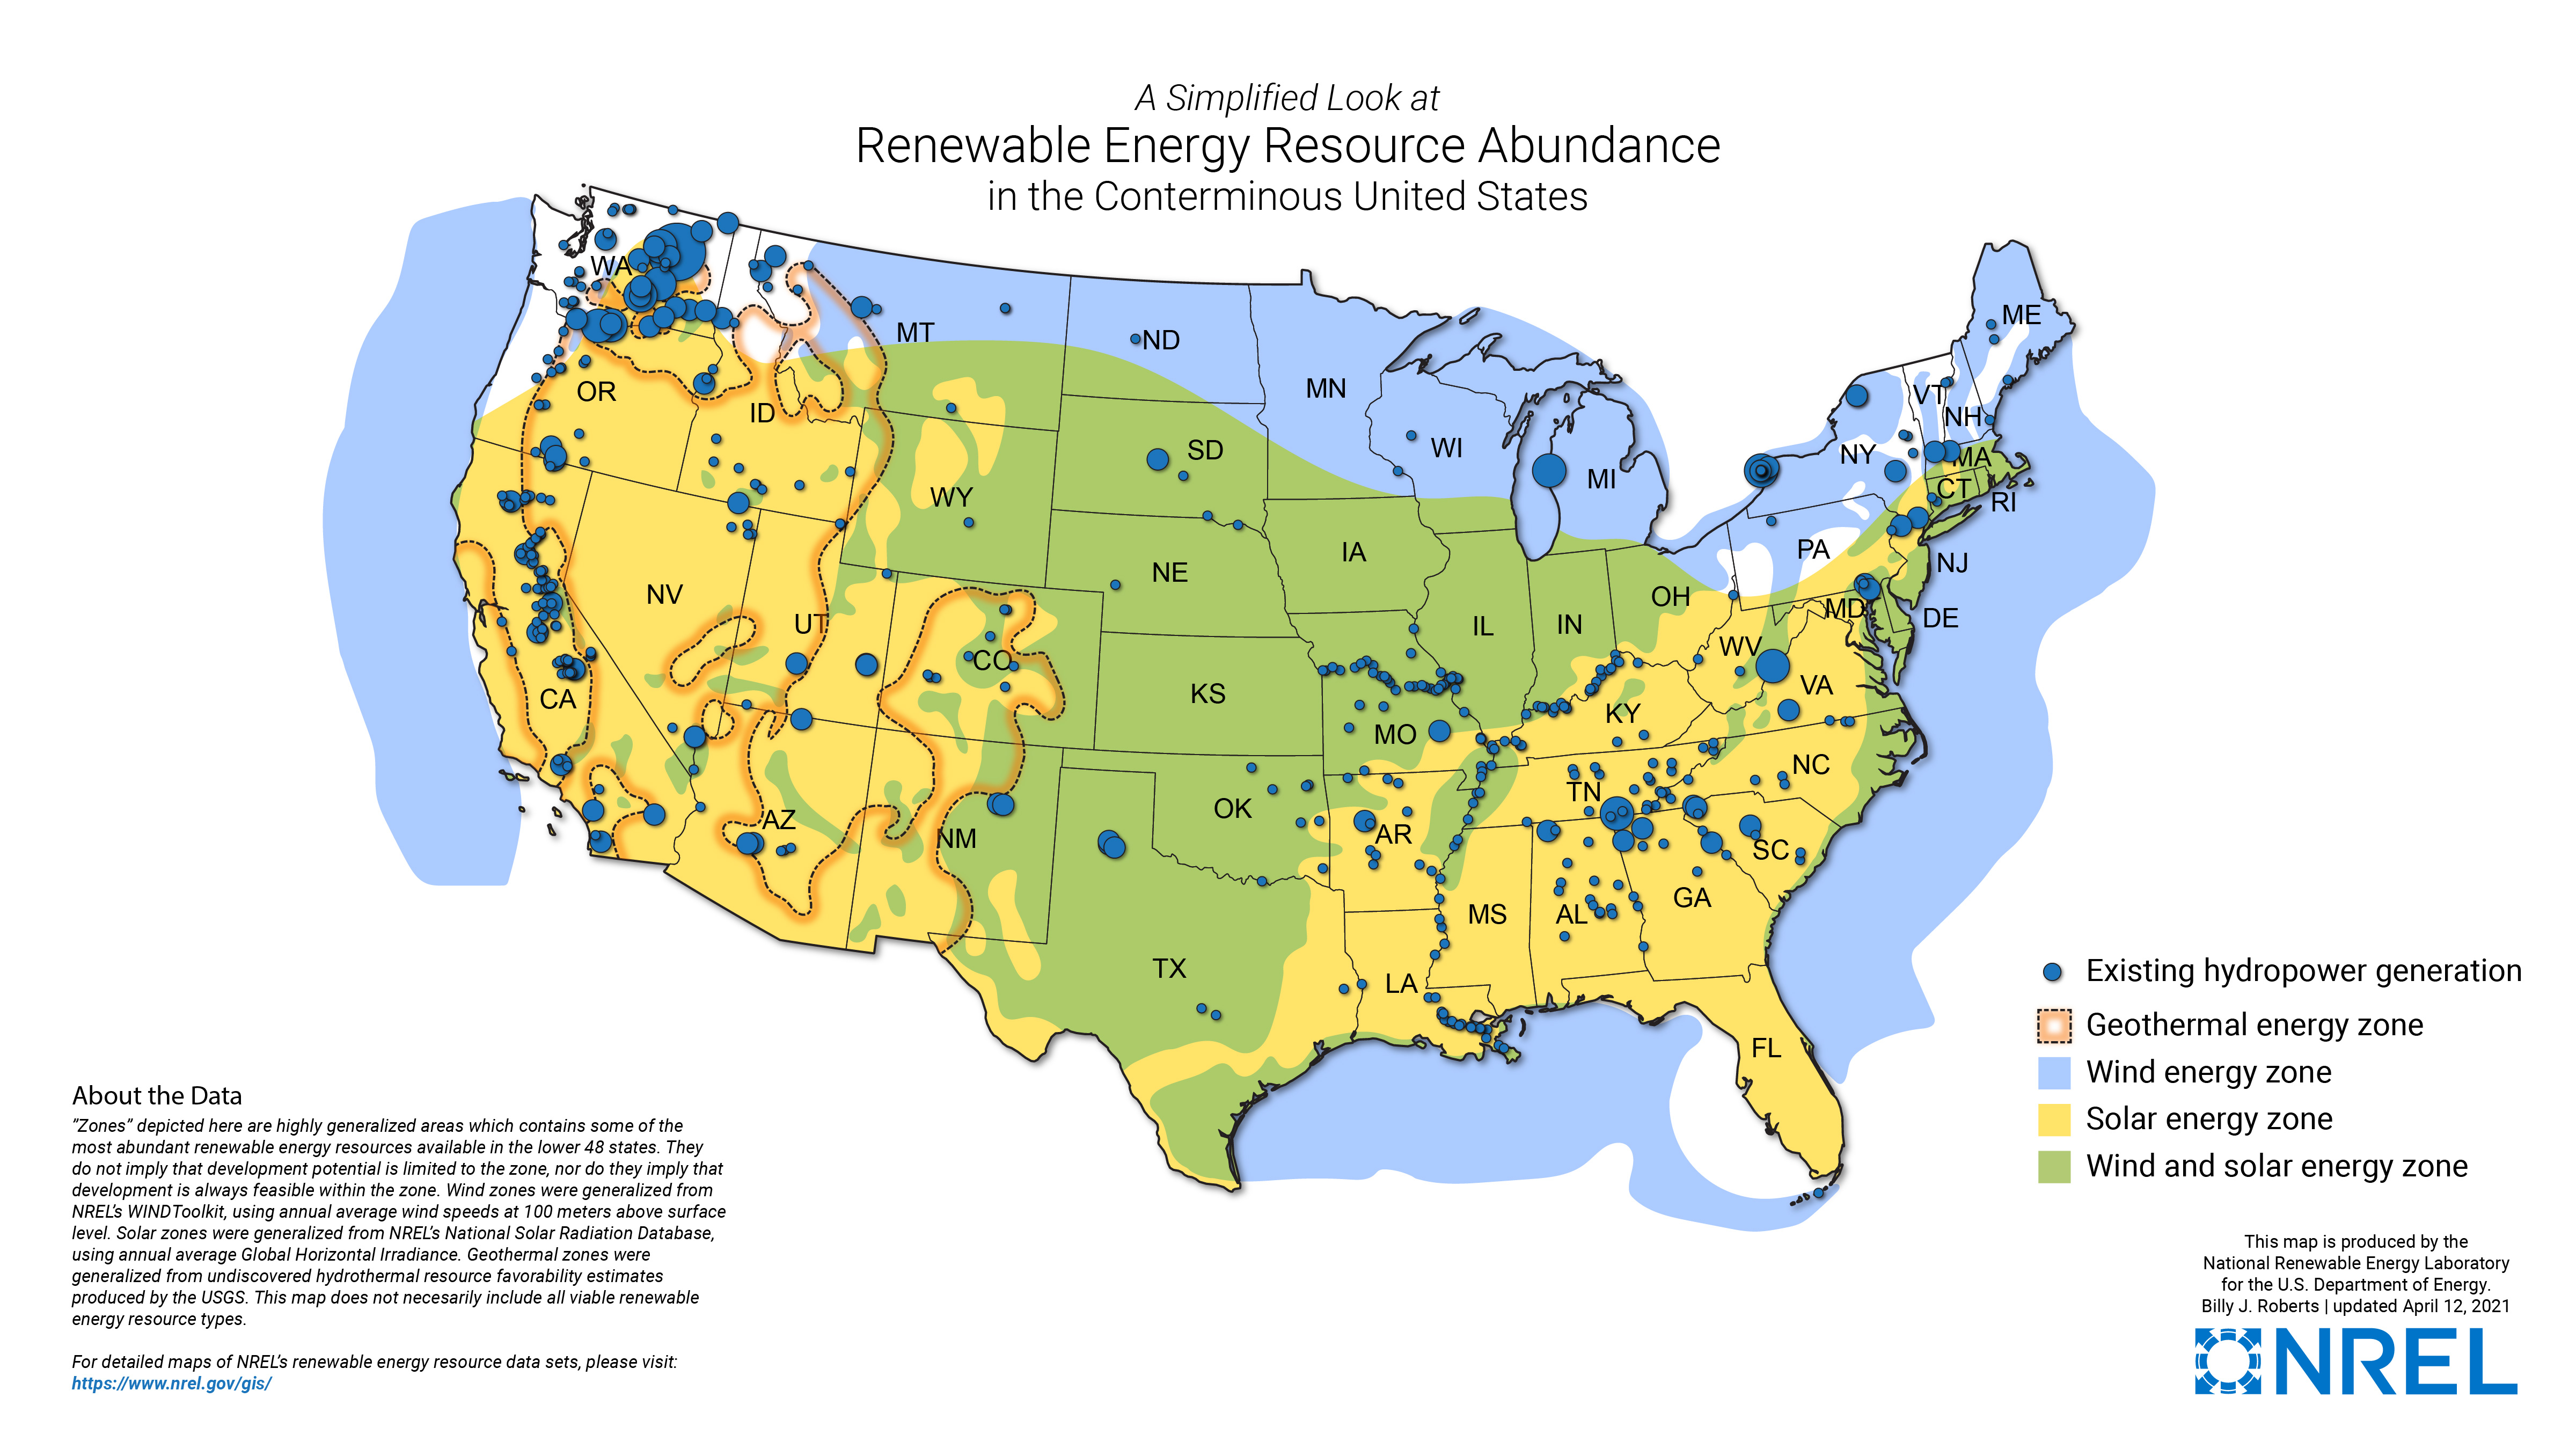
File:Map of major renewable energy resource in the contiguous United ...
Us Energy Production Map

Us Energy Production Map
Connections: Energy Mapping

Connections: Energy Mapping
Us Energy Production Map

Us Energy Production Map
Realtime Electricity Map Shows The Sources Of The Energy Visualizing

Realtime Electricity Map Shows The Sources Of The Energy Visualizing
The United States Of Energy - Vivid Maps

The United States of energy - Vivid Maps
Us Energy Production Map
Us Energy Production Map
Us Energy Production Map
Us Energy Production Map
Map Of Solar Energy Production Sites

Map Of Solar Energy Production Sites
US Energy Production Hubs Map Interactive American Power Plant Geography

US Energy Production Hubs Map Interactive American Power Plant Geography
Energy Infrastructure Maps - Data.gov

Energy Infrastructure Maps - Data.gov
Us Energy Production Map

Us Energy Production Map
Us Energy Production Map
Us Energy Production Map
Us Energy Production Map U.S. Energy Demand To Rise 15% In Next 5

Us Energy Production Map U.S. Energy Demand To Rise 15% In Next 5
Maps - U.S. Energy Information Administration (EIA)
Maps - U.S. Energy Information Administration (EIA)
Us Energy Production Map

Us Energy Production Map
Us Energy Production Map

Us Energy Production Map
