Exploring the Map of U.S. Slavery: Geography, History, and Legacy
In this guide, you will discover how the spatial distribution of slavery shaped the United States, learn to read and interpret key historical maps, and understand the economic, political, and social forces that drove the institution from the early 1800s to its eventual abolition. By the end, you’ll have a clear picture of how geography and slavery intersected to influence American development.
Historical Context of Slavery in the United States
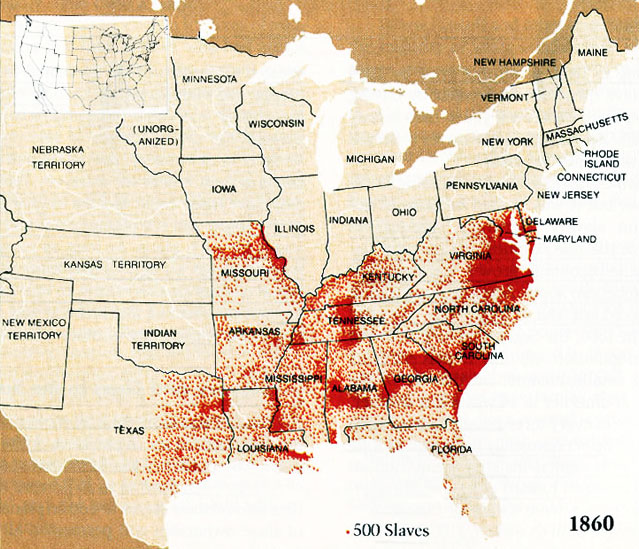
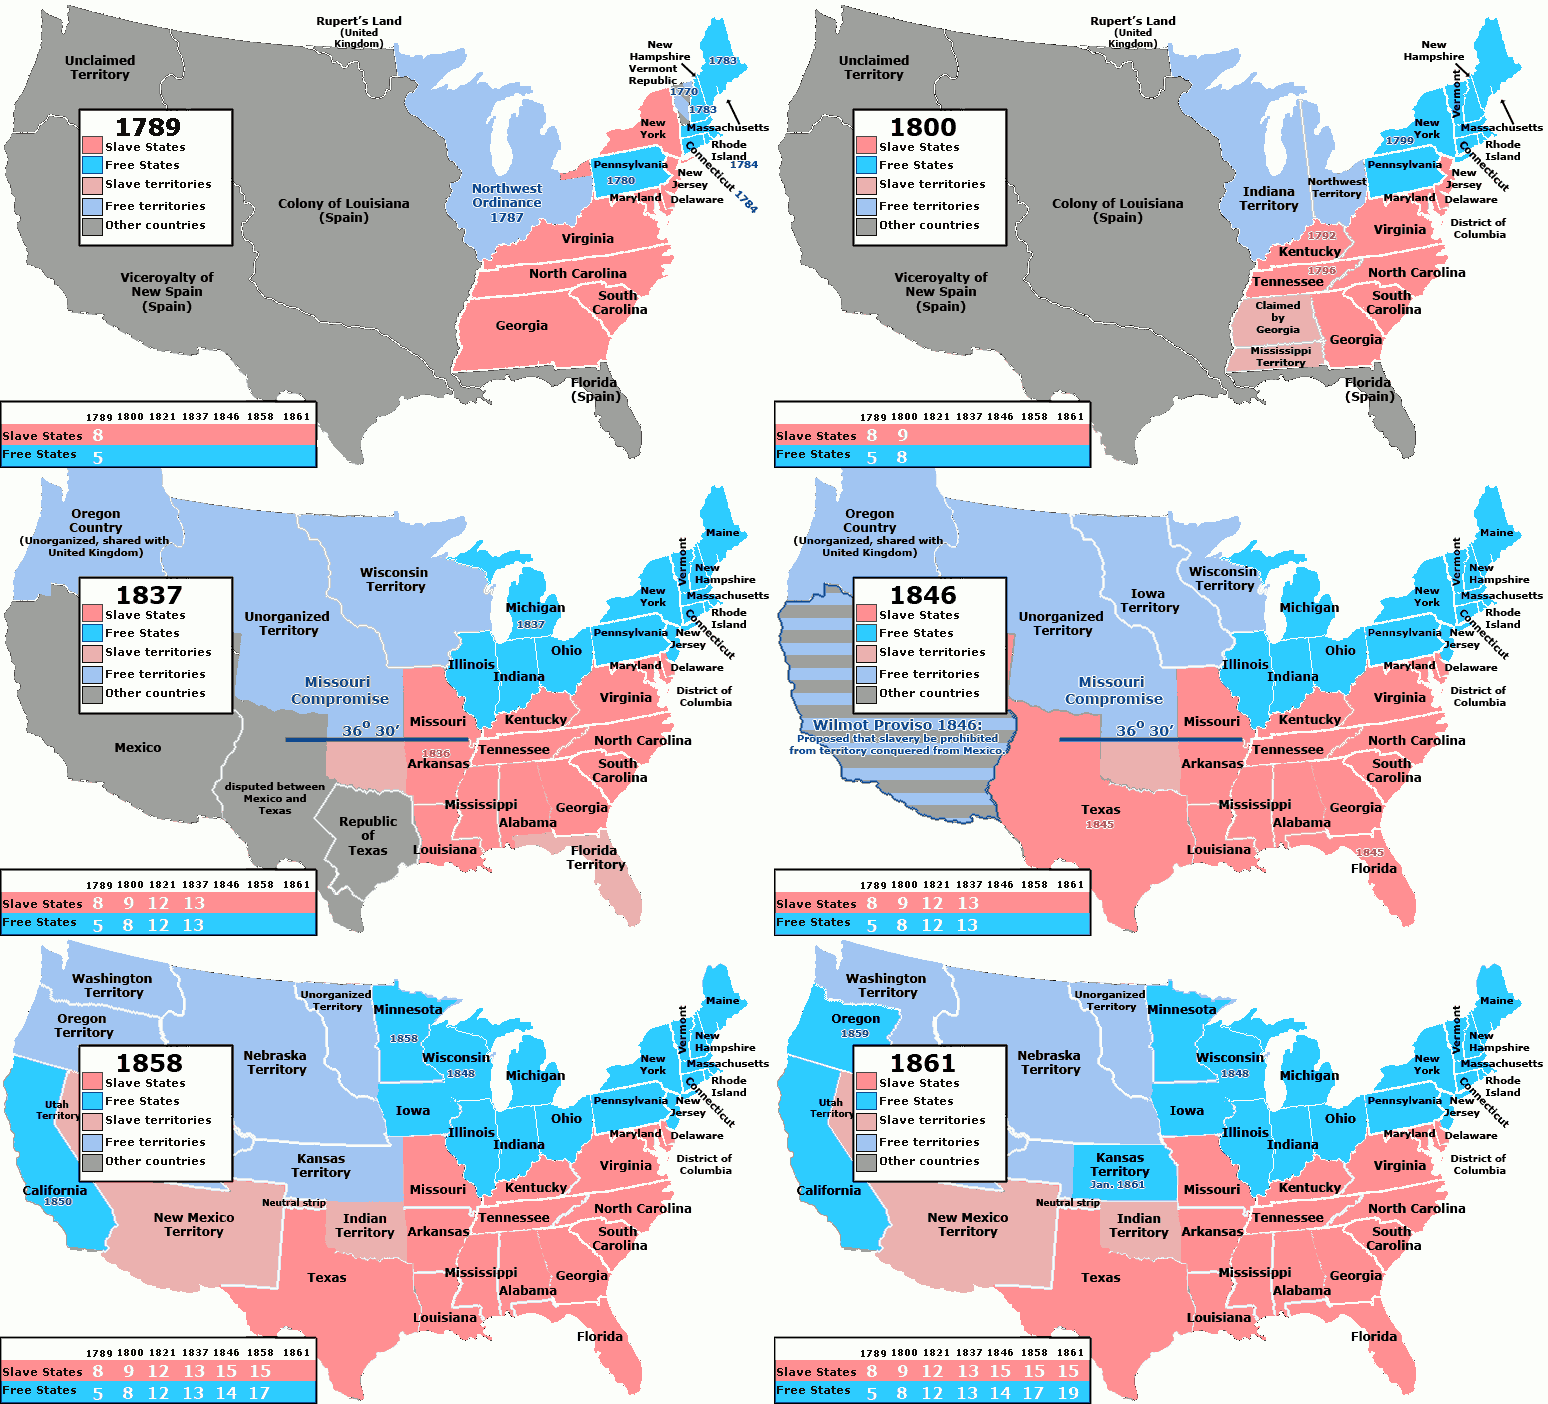
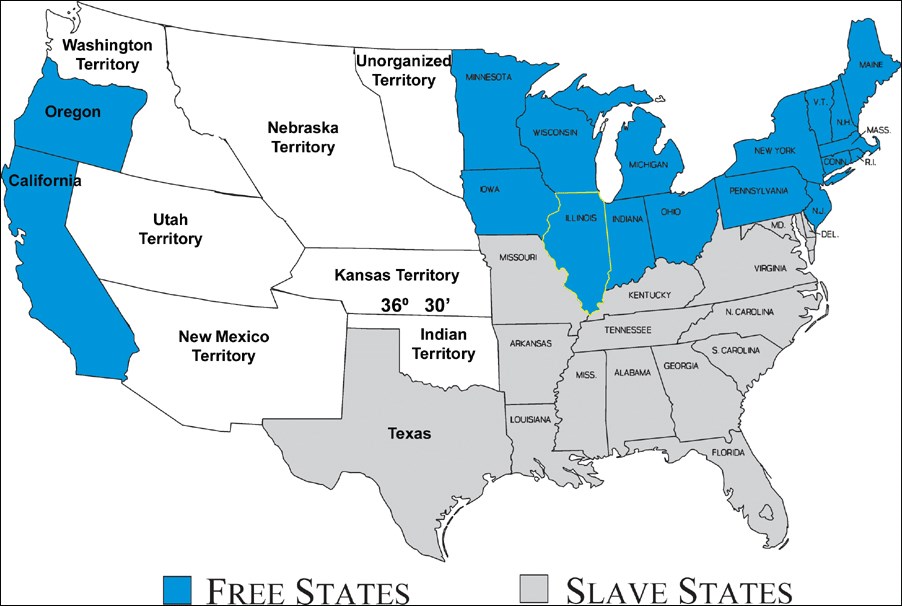
Slavery entered the American colonial landscape in the early 17th century, evolving from a labor system based on indentured servitude to a racially defined practice that endured for nearly two centuries. By 1861, the United States was deeply divided: the Northern states had largely abolished slavery, while the Southern states relied on it for their agrarian economies. The 1861 map below captures this stark division and serves as a primary source for scholars and educators alike.
The Geographic Spread of Slavery: North vs. South
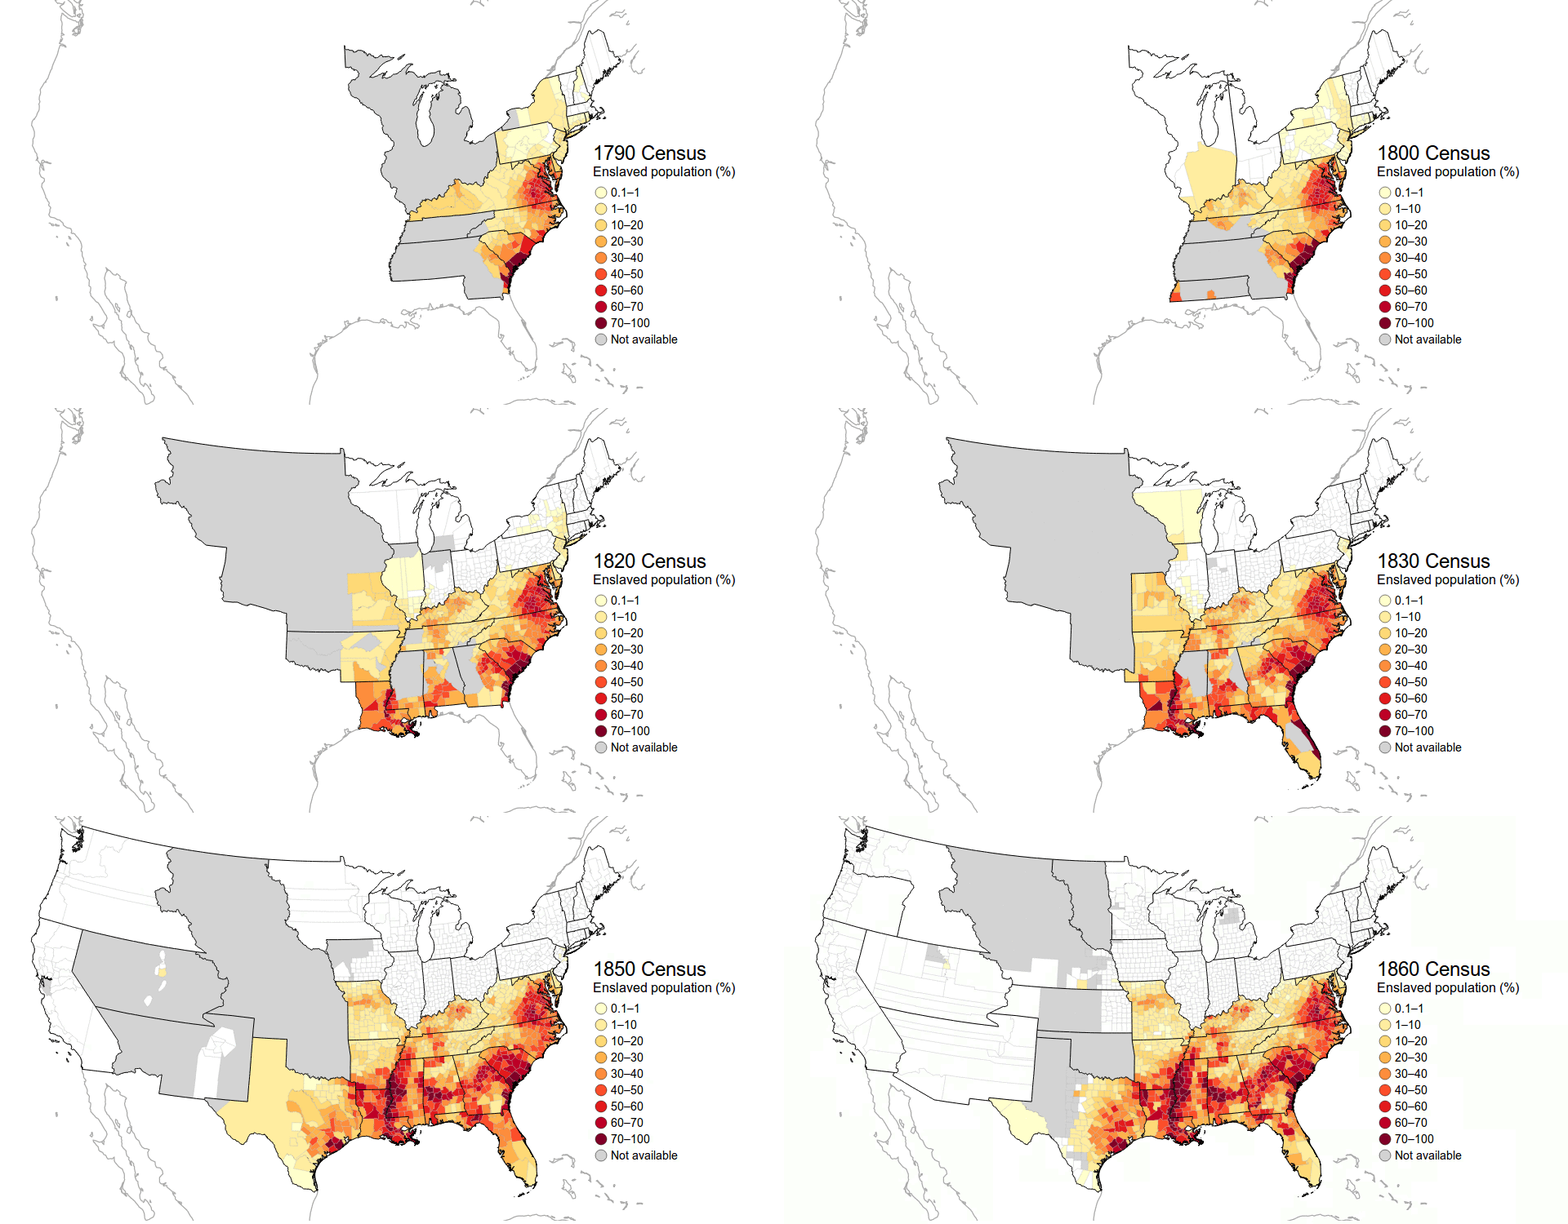
The map illustrates a clear demarcation between slaveholding and non-slaveholding states. In the South, states such as Virginia, South Carolina, and Georgia display dense shading, indicating high numbers of enslaved people per capita. In contrast, northern states like New York and Massachusetts show little to no shading, reflecting the gradual abolition of slavery. This spatial pattern underscores how slavery was largely confined to the agricultural South, while the North pursued industrial growth.
Analyzing the 1861 Map
Examining the 1861 map, we can identify several key features:
- Color Coding: The darker the hue, the greater the proportion of enslaved individuals in that state.
- State Boundaries: Clearly demarcated, allowing for precise comparisons across the Union.
- Population Density: Some states with high population densities still had low slavery rates, illustrating the complex interplay between demographics and economic structures.
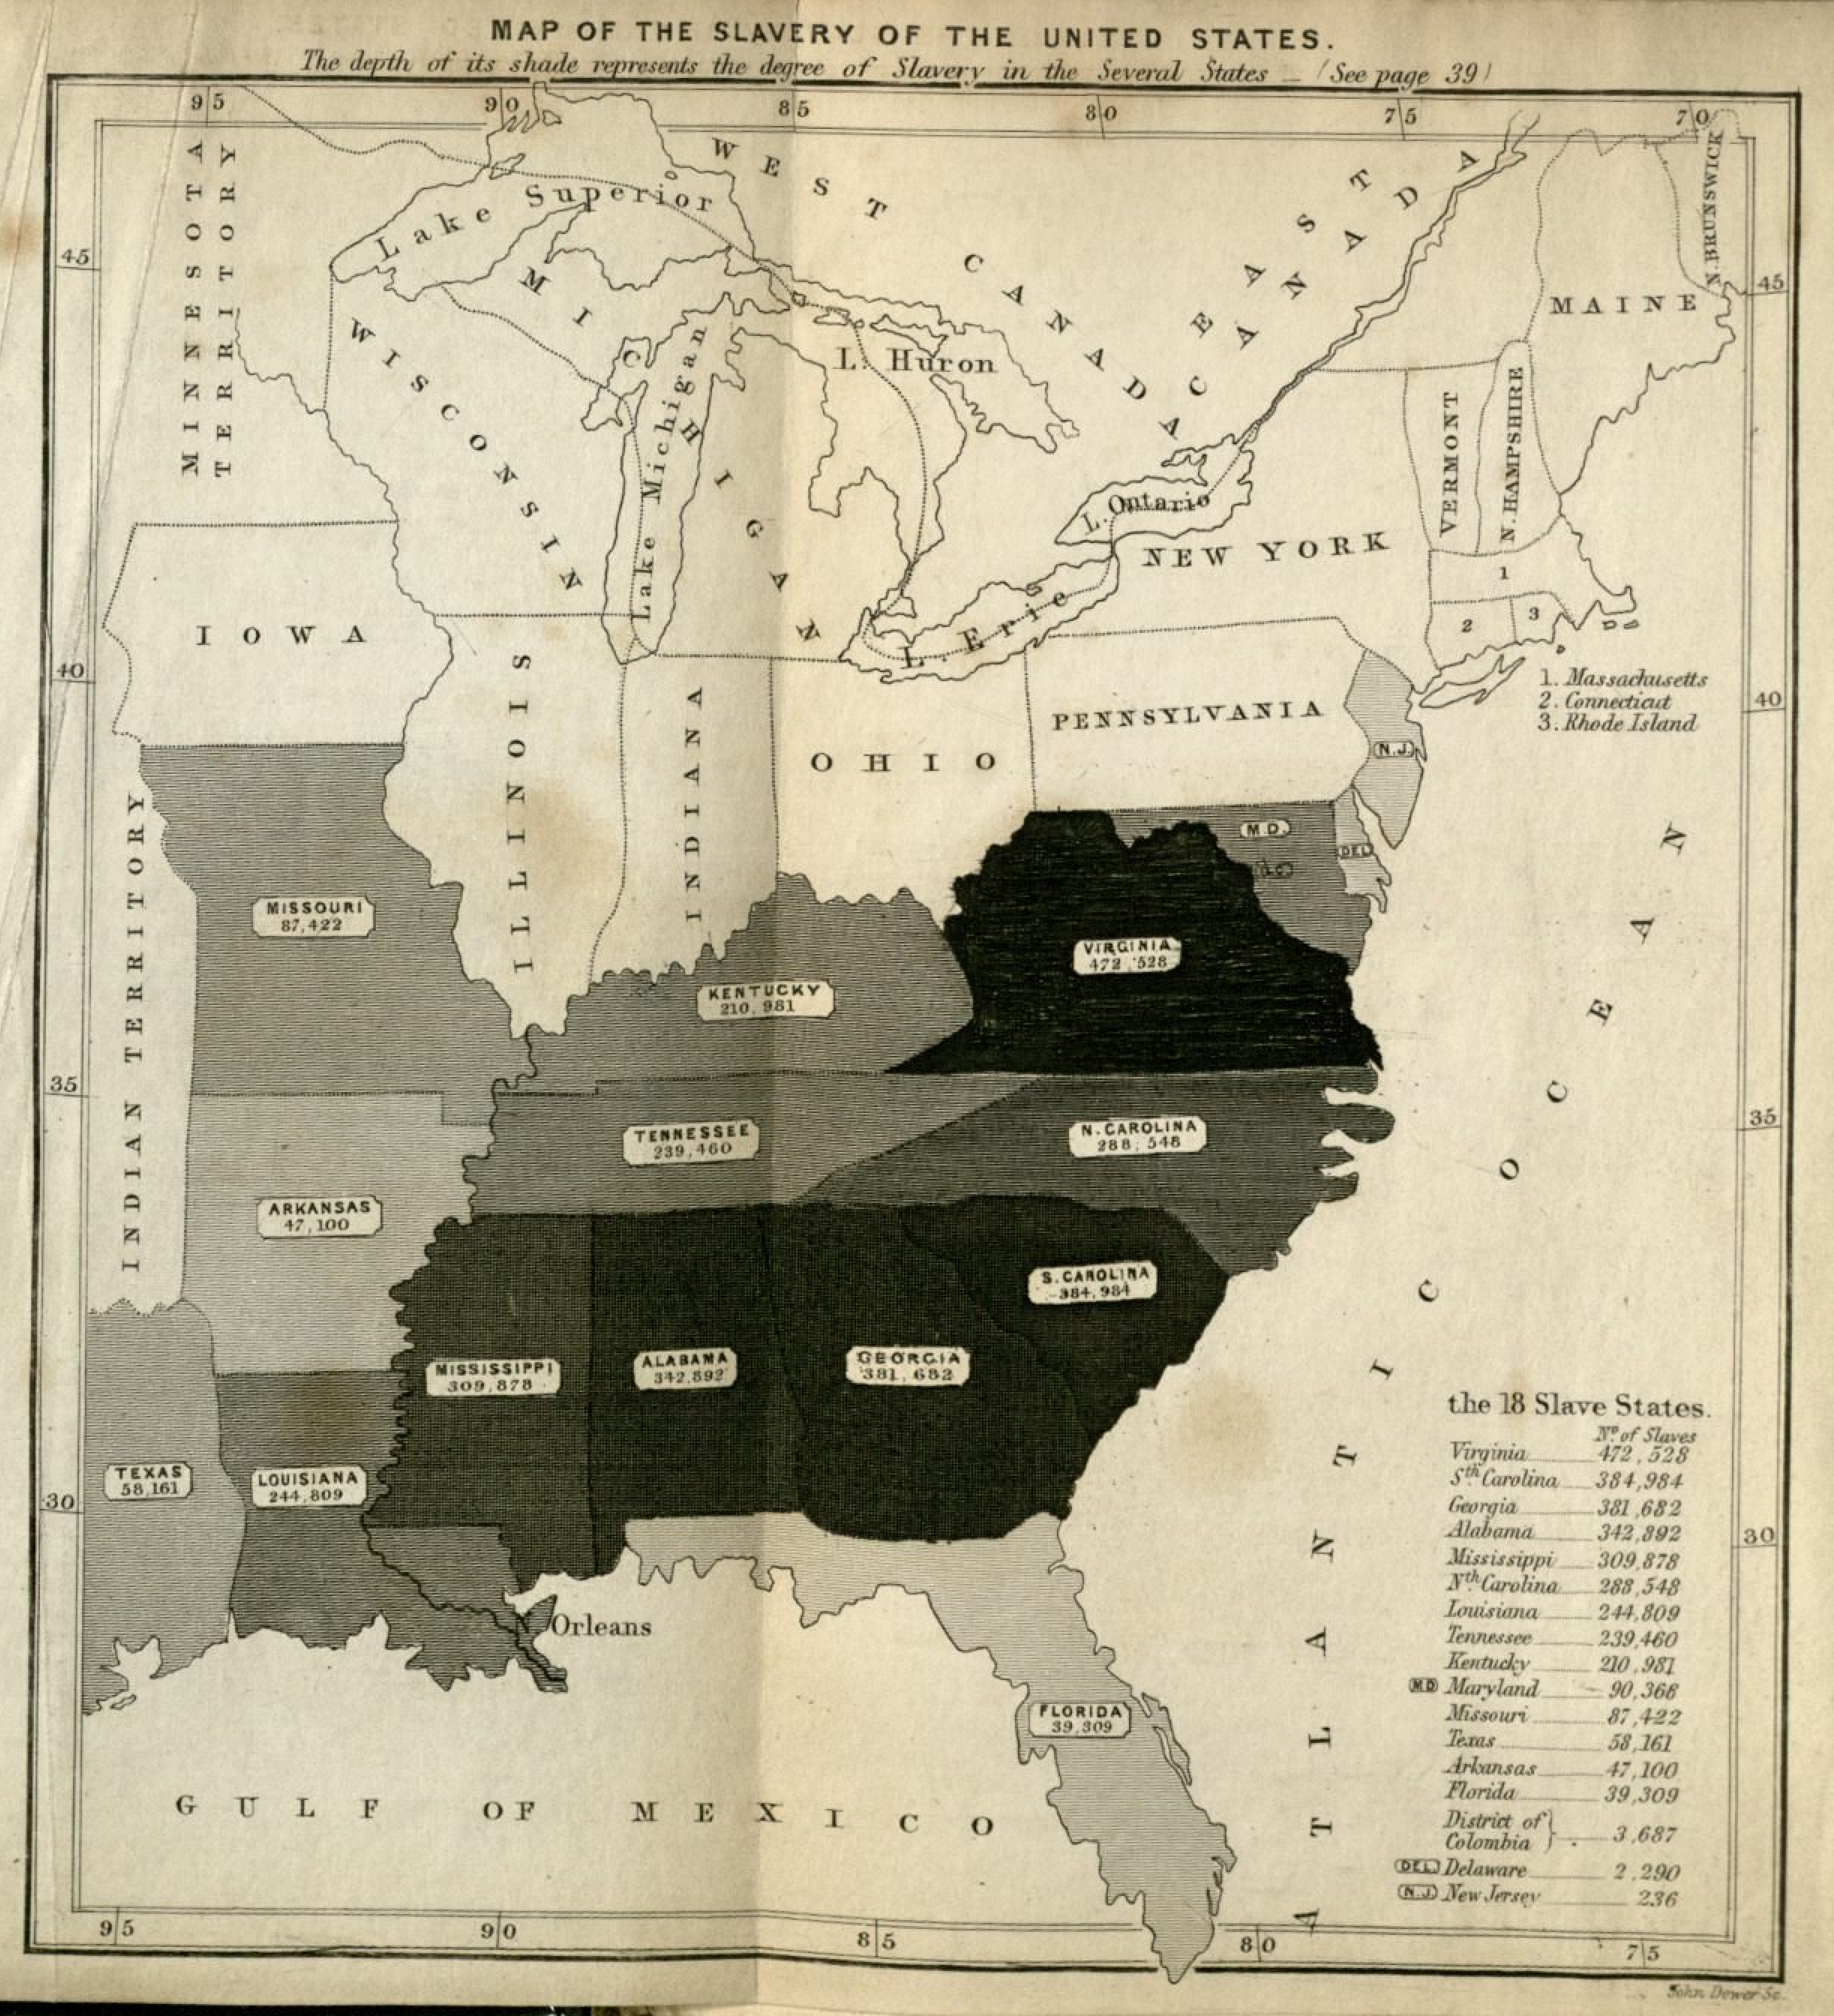
The accompanying 1861 map from Harvard's collections offers a slightly different visual representation, emphasizing the legal and societal frameworks that governed slavery. This second image provides additional context for the political debates that fueled the Civil War.
Key Regions and Their Significance
Understanding the importance of specific regions helps to explain the economic foundations of slavery:
- The Deep South: States like Mississippi, Alabama, and Louisiana were the heart of the cotton economy, relying heavily on enslaved labor for plantation production.
- The Upper South: Virginia and Kentucky had mixed economies, with both plantation and small-scale farming, yet they maintained significant enslaved populations.
- The Frontier: States such as Texas and Arkansas were emerging territories, where the expansion of slavery was a contentious issue that intensified sectional tensions.
Economic Implications of the Slave Trade
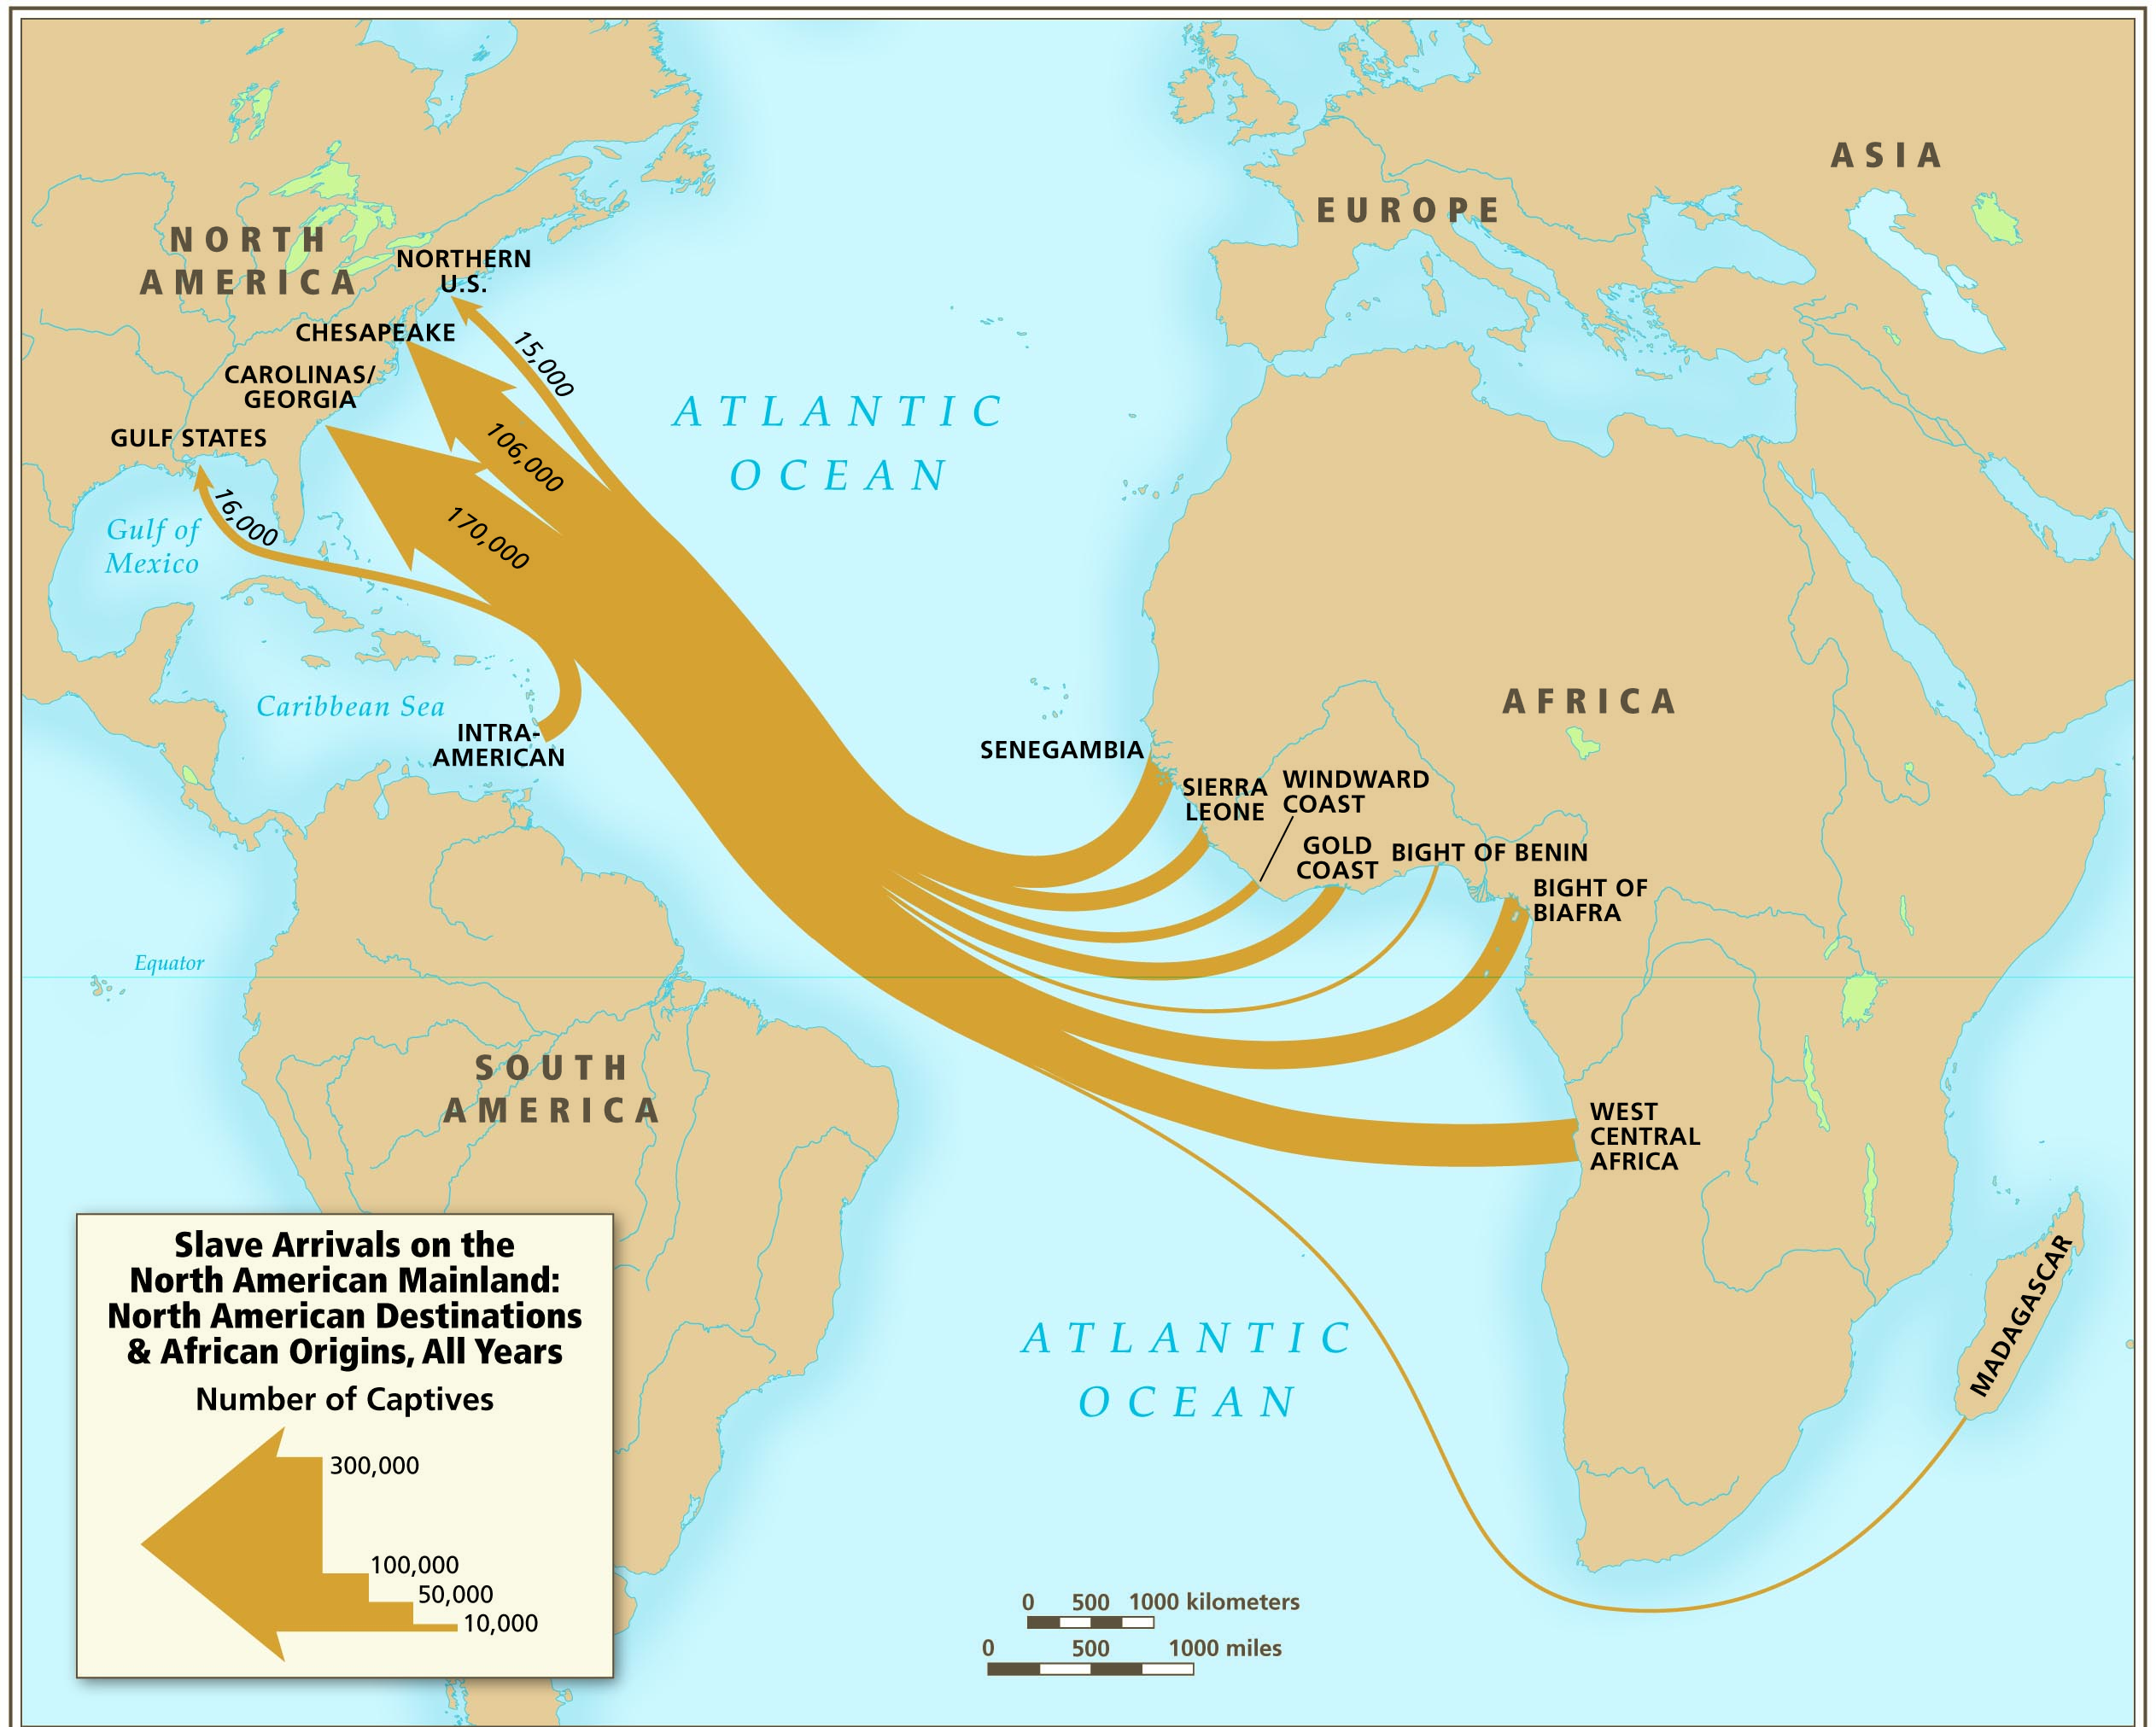
Slavery was the backbone of the Southern economy, driving exports of cotton, tobacco, and rice. The triangular trade connected the United States, West Africa, and Europe, creating a profitable cycle that reinforced the institution. This economic dependency made the South fiercely protective of slaveholding rights, shaping its political stance in national affairs.
Transition to Emancipation and Reconstruction
The Civil War marked the beginning of a new era. The Emancipation Proclamation and the eventual passage of the Thirteenth Amendment abolished slavery. Reconstruction saw attempts to integrate formerly enslaved people into civic life, though challenges like Black Codes and Jim Crow laws limited progress. Maps from this period show shifting boundaries as former Confederate states rejoined the Union and as new states formed in the West.
Modern Interpretations and Lessons
Today, these historical maps serve as powerful tools for education and remembrance. They remind us that geography played a vital role in shaping the United States’ social and economic landscape. By studying the spatial distribution of slavery, scholars can better comprehend how the legacy of this institution continues to influence contemporary social inequities.
Conclusion
The maps of slavery in 1861 are more than cartographic artifacts; they are visual narratives that encapsulate the profound disparities and tensions of a nation divided. By exploring these images and the historical context they represent, readers gain insight into how geographic and economic factors forged the path from a slaveholding society to the United States of today. The legacy of this era remains an essential chapter in understanding American identity and its ongoing pursuit of equity and justice.
Color-coded Map Illustrates The Distribution Of The Slave Population

Color-coded map illustrates the distribution of the slave population ...
Map Showing The Distribution Of The Slave Population Of The Southern
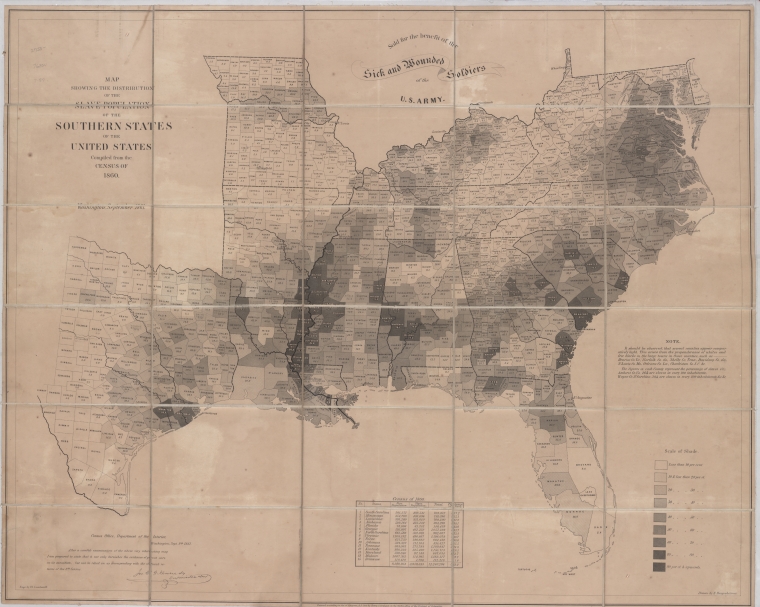
Map showing the distribution of the slave population of the southern ...
Reynolds's Political Map Of The United States, Designed To Exhibit The

Reynolds's political map of the United States, designed to exhibit the ...
The Causes Of The Civil War - CIVIL WAR SAGA

The Causes of the Civil War - CIVIL WAR SAGA
End Of Slavery In The United States - Wikipedia

End of slavery in the United States - Wikipedia
Map Of Free And Slave Areas In The USA In 1860 (colour Litho)

Map of Free and Slave Areas in the USA in 1860 (colour litho)
Map Showing The Distribution Of The Slave Population Of The Southern

Map showing the distribution of the slave population of the southern ...
The Origins Of Slavery | Gilder Lehrman Institute Of American History
The Origins of Slavery | Gilder Lehrman Institute of American History
These Maps Reveal How Slavery Expanded Across The United States

These Maps Reveal How Slavery Expanded Across the United States ...
1861 Map Of Southern Slave Population – U.S. Census-Based Map Showing

1861 Map of Southern Slave Population – U.S. Census-Based Map Showing ...
Origins Of The American Civil War - Wikipedia
Origins of the American Civil War - Wikipedia
Datei:United States Slavery Map 1860.jpg – Wikipedia

Datei:United States Slavery Map 1860.jpg – Wikipedia
These Maps Reveal How Slavery Expanded Across The United States
These Maps Reveal How Slavery Expanded Across the United States ...
Resources :: These Maps Reveal How Slavery Expanded Across The United

Resources :: These Maps Reveal How Slavery Expanded Across the United ...
"Journey From Slavery To Statesman": The Homes Of Frederick Douglass (U
"Journey from Slavery to Statesman": The Homes of Frederick Douglass (U ...
